Using contextual priors for decoding
Use contextual priors by feeding topic weights from one decoding into another.
Start with the necessary imports
from os.path import join
import matplotlib.pyplot as plt

import numpy as np
import nibabel as nib
from nilearn import plotting

from gclda.model import Model
from gclda.decode import encode, decode_continuous
from gclda.utils import get_resource_path
Load model and initialize decoder
model_file = join(get_resource_path(), 'models/Neurosynth2015Filtered2',
                  'model_200topics_2015Filtered2_10000iters.pklz')
model = Model.load(model_file)
Extract topic weights for text as prior
text = 'faces and faces and faces face the other faces against facial discrimination'
_, prior = encode(model, text)
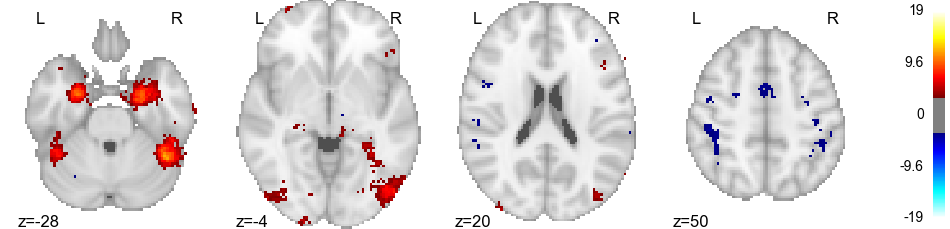
Read in image to decode
file_to_decode = '../data/faces_specificity_z.nii.gz'
img_to_decode = nib.load(file_to_decode)
fig = plotting.plot_stat_map(img_to_decode, display_mode='z',
                             threshold=3.290527,
                             cut_coords=[-28, -4, 20, 50])
Decode image without prior
_, posterior1 = decode_continuous(model, img_to_decode)

# max-normalize and sort for visualization
posterior1 = posterior1 / np.min(posterior1)
sorter = posterior1.argsort()
posterior1 = posterior1[sorter]
Decode image with weak prior
_, posterior2 = decode_continuous(model, img_to_decode, topic_priors=prior, prior_weight=0.01)

# max-normalize and sort for visualization
posterior2 = posterior2 / np.min(posterior2)
posterior2 = posterior2[sorter]
Decode image with strong prior
_, posterior3 = decode_continuous(model, img_to_decode, topic_priors=prior, prior_weight=0.05)

# max-normalize and sort for visualization
posterior3 = posterior3 / np.min(posterior3)
posterior3 = posterior3[sorter]
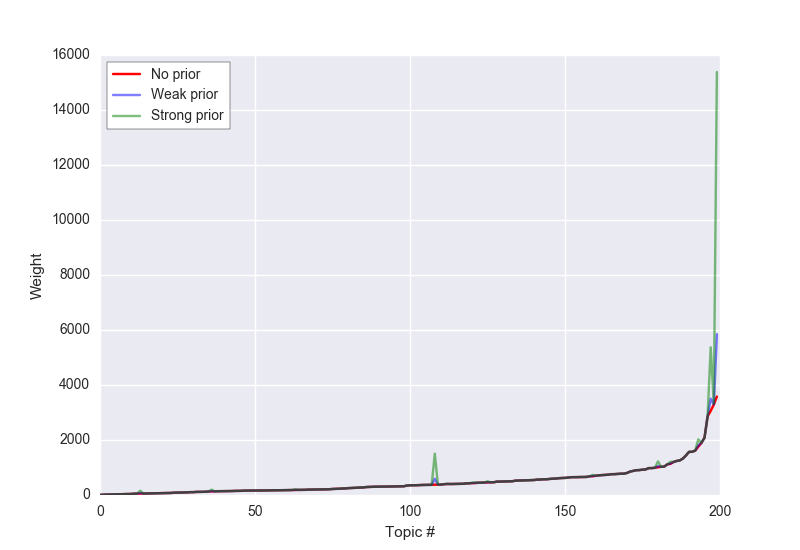
Plot topic weights
fig2, ax2 = plt.subplots()
ax2.plot(posterior1, color='r', label='No prior')
ax2.plot(posterior2, color='b', label='Weak prior', alpha=0.5)
ax2.plot(posterior3, color='g', label='Strong prior', alpha=0.5)

legend = ax2.legend(frameon=True, loc='upper left')
frame = legend.get_frame()
frame.set_facecolor('white')
frame.set_edgecolor('black')

ax2.set_xlabel('Topic #')
ax2.set_ylabel('Weight')
fig2.show()
Total running time of the script: ( 1 minutes 44.248 seconds)